Indirect Taxes
Indirect Taxes are taxes imposed on goods and services on buying, and are partially payed by producers and consumers. There are two types of indirect taxes:


Subsidies
Subsidies - Subsidies are a sum of financial assistance to assist industries and businesses so price of commodity or service may remain low or competitive
There are different types of subsidies that are offered


Rent Controls:
Price ceilings are placed also on rents of apartments as well.
This has many consequences: housing become more affordable to low income people. However, this creates a shortage of housing, which leads to long waiting lists, and also creates an illegal market. Lastly, there is run-down and lowly maintained buildings as its not a profitable business.
HL: Calculating effects
Shortage is equal to Q0 - Q1
Change in consumer expenditure changes from (P0 x Q0) to (P1 x Q1)
Change in producer revenue is same as consumer expenditure


Indirect Taxes are taxes imposed on goods and services on buying, and are partially payed by producers and consumers. There are two types of indirect taxes:
- Excise Tax - This sort of tax is imposed on particular goods/services, e.g. alcohol, cigarettes, petrol
- Value Added Tax - This tax is imposed on all goods. Is also known as General Sales Tax in some countries. (e.g. VAT in Thailand is 7%)
Indirect taxes differ from direct tax, which are direct payments to the government.
A tax often causes a the price to increase, which leads to less affordability, and less purchase. Also, as some portion of the tax derives from the producer, the lower price means producers are less willing to supply much quantity.
Why are Government Taxes imposed?
- Source of Government revenue: Governments can get a great deal of money through taxes! Harmful goods, such as alcohol, cigarettes are price inelastic, therefore a government can add a lot of excise tax without altering the demand much, thus gaining a lot of revenue without harming the jobs of the workers much
- Discouragement: Tax reduces affordability of harmful goods, reducing consumption. However, the extent of discouragement depends on the elasticity of goods.
- Redistribute income: In some countries, taxes are placed on expensive goods such as luxury cars, gold jewellery, yachts etc. As this is only affordable by high-income earners, the tax taken by the government is then distributed back into the public, narrowing the income gap.
- Improve allocation of resources: If there is market inefficiency, tax maybe added to improve the allocation of resources.
Specific Tax - A specific amount of tax is imposed per unit
Ad Valorem - A specific percentage of the price or good imposed as tax. Value of tax increases with price of good.
- Equilibrium quantity falls from Q1 to Qt. Equilibrium price increases from P1 to Pc
- Price received by producers falls from P1 to Pp per unit
- Firms revenue falls from P1 X Q1 to Pp X Qt
- Government receives tac from (Pc - Pp) X Qt , the green area shaded
- There is under allocation of resources to production of good than demanded, from Q1 to Qt
Consequences of imposing indirect tax:
- Consumers: affected in two ways. They have a higher price to pay, and also for a lesser quantity.
- Producers (firms): Producers suffer a fall in the price they receive and by fall in output they sell. (Q1 x P1) to (Qt x Pt)
- Government: Only stakeholder to gain. Receives revenue (Pc - Pp) x Qt . Also, able to reduce harmful factors from society
- Workers: Because quantity supplied (Q1 to Qt) . Lower quantity means less people needed to produce, leading to some unemployment.
- Society: Society worse off as result of tax because under allocation of resources to production.
HL: Plotting a graph
Remember, its only another supply curve you need to add. So the tax value change must be substituted in the function. For example, if their is a an addition of a $6 tax...
Qs = -2 + 2(P)
Qs(with tax)= -2 + 2(P - 6)
= -2 + 2P -12
= -14 + 2P
Then make Qd = Qs(with tax) and find the price
For now, lets make up some data up for now
Lets say:
P1 = $16 and Q1 = 28
Pc (P1 with tax) = $19 and Qt (new quantity after tax) = 22
Pp (new price for producer) = $13 and Qt (new quantity after tax) = 22
Consumer Expenditure
Consumer expenditure falls from P1 x Q1 = 16 x 28 = 448
to
Pc x Qt = 19 x 22 = 418
Therefore, consumer expenditure fell $30
Producer Revenue
Producer revenue falls from
P1 x Qt = 16 x 28 = 448
to
Pp x Qt = 13 x 22 = 286
Therefore, producer revenue fell $162
Government Revenue
a) Producer revenue can be calculated from Consumer expenditure - Producer Revenue
418 - 286 = 132
b) Can be calculated from (Pc - Pp) x Qt , therefore, (19-13) x 22 = 132
As you can see, due to the tax, a portion of both, the consumer and producer surplus has been lost to the government revenue. However, the after tax social surplus is equivalent to after tax producer and consumer surplus + government revenue. In which case the social surplus is the same
However, if compared to pre-tax supply, the social surplus has been reduced by the areas of A +B, which has been completely lost (welfare loss)
Welare Loss - represents welfare benefits lost to society because resources are not allocated efficiently.
The welfare loss exists as the tax causes smaller than required quantity to be produced (underproduction of good relative to what is socially required; and also a under allocation leading to allocative inefficiency)
In some cases, you would be required to calculate the consumer and producer surplus. This may seem hard however you just need to use basic maths and the triangle formula to calculate the area of the section specified.
e..g
Consumer Surplus = (P intercept of D curve- Pc) x Qt
Producer Surplus = (Pp - P intercept of S curve) x Qt
Welfare Loss can be calculate by pre-tax total surplus minus after tax surplus (consumer, producer surplus, gov revenue)
Tax Incidence and Price Elasticity

Credit: http://thismatter.com/economics/images/tax-burdon-elasticity.png
Note:
Orange = Consumers Burden
Pink = Producers Burden
Demand
When Demand is inelastic, most of the tax burden is on the consumers; when demand is elastic, most of the burden is on the producers
This is basic concepts. When a demand is inelastic, that means the market would be unresponsiveness to a change in price, which the producer would like to utilise to maximise their profits instead of taking up the burden. While, an elastic good would have to be affordable and attractive pricing to be able to attract consumers, in which case the producer will take the bigger portion of the tax burden.
Supply
When supply is inelastic, the bigger tax burden is on the producers; when supply is elastic, the bigger tax burden is on consumers .
Simple Rule
The more elastic a schedule, the more of the tax on the other side. In general, tax burden falls proportionately on side whose activities are less responsive to price changes. E.g. when supply inelastic, producers take burden. When demand inelastic, consumers take burden
The more elastic a schedule, the more of the tax on the other side. In general, tax burden falls proportionately on side whose activities are less responsive to price changes. E.g. when supply inelastic, producers take burden. When demand inelastic, consumers take burden
Subsidies
Subsidies - Subsidies are a sum of financial assistance to assist industries and businesses so price of commodity or service may remain low or competitive
There are different types of subsidies that are offered
- Tax Relief - Paying lower, or no tax
- Low-interest, Interest-free loans - to encourage producers to use more money, or students to take l loans for studies
- Provision of resources by government - some governments may provide free or cheap resources. e.g. give land to factories
A subsidy granted by the firm has increases price received by producers, encouraging them to produce more, and lowering price paid by consumers, encouraging them to buy more, This leads to change in allocation of resources, and a greater production and consumption than in the free market.
Governments grant subsidies for various reasons :
- Subsidies can be used to increase producer revenue of business they support (e.g. agriculture). This also raises income of workers
- Subsidies lower price of certain goods to make it more affordable for low income earners by subsidising producers
- Subsidies can be used to increase consumption, e.g. subsidising education, health care,
- Subsidies can be used to catalyse growth of particular industries (e.g. subsidies to solar panel producers)
- Subsidies given to particular goods to increase quantity exported
- Subsidies may be used to improve allocative efficiency by correcting positive externalities

Credit: http://www.economicsonline.co.uk/How%20markets%20work%20graphs/Subsidy-areas-incidence.png
The impacts of the subsidies are:
- Equilibrium quantity consumed and produced increases
- Equilibrium price falls
- Price received by producer increases from P to C
- Amount of subsidy = (C-P) x Q1
- Overallocation of resources, as quantity more than free market equilibrium
As a result of subsidies, there are many consequences to the stake holders.
- Consumers benefit as they gain by a fall in price and an increase in quantity
- Producers benefit because they receive a higher price and also produce a larger quantity. (In some ways, the subsidies reduce their cost of production, making the business more profitable)
- The Government - the government receives a negative impact as there is a burden on their budget, and would have to cut expenditures in other sectors
- Workers benefit as output increase means more workforce needed, thus more people employed
- Society as whole is worse off as overallocation of resources
- Foreign producers are worse off as products become more competitive for internal sales and exports
HL: Graphing Subsidies
Given a supply function, of Qs = c +dP, whenever there is a shift downwards (due to subsidies), replace the function by Qs = c + d(P + s) .
The granting of a subsidy results in greater consumer and producer surplus; however, society loses due to government spending on the subsidy. Because loss from government is greater than gain from consumers and producer surplus => Welfare loss, showing allocative inefficiency. D = MB < MC
Now, how would you calculate the producer and consumer surplus gain
Basically :
Consumer Surplus pre tax minus Consumer surplus post- tax
The similar concept is for Producer Surplus. Producer surplus pre-tax minus producer surplus after tax.
Price Controls
Price Control is minimum or maximum prices set by governments, so prices are unable to adjust to equilibrium in free market. Price controls result in market disequilibrium, therefore shortages and surpluses
Price Ceilings
- Governments may impose price ceilings to make required goods/services affordable for consumers

- As seen , the quantity supplied at P ceiling clearly falls short of the free market equilibrium Quantity Q* and also the desirable demand for the new price Qd. Therefore, creating an excessive amount of suggestion.
- There are many consequences of implementing a price ceiling
- Shortages
- Non Price Rationing - Fair allocation of scarce resources . As there is no way a scarce resource can be distributed among all interested buyers, the government will have to take actions. Firstly, they could use the waiting principal in which it is first-come-first served. Secondly, coupons can be distributed to allow interested buyers to purchase a fixed amount over a given period. Thirdly, they can carry out favouritism in which case sellers can sell goods to preferred customers. These can lead customers unsatisfied
- Such price ceilings can also lead to underground markets. Sell it at more than maximum price.
- Also, as less products are supplied to what is desirable, leads to a lack of allocation of resources
Credit: http://images.slideplayer.com/5/1583831/slides/slide_45.jpg
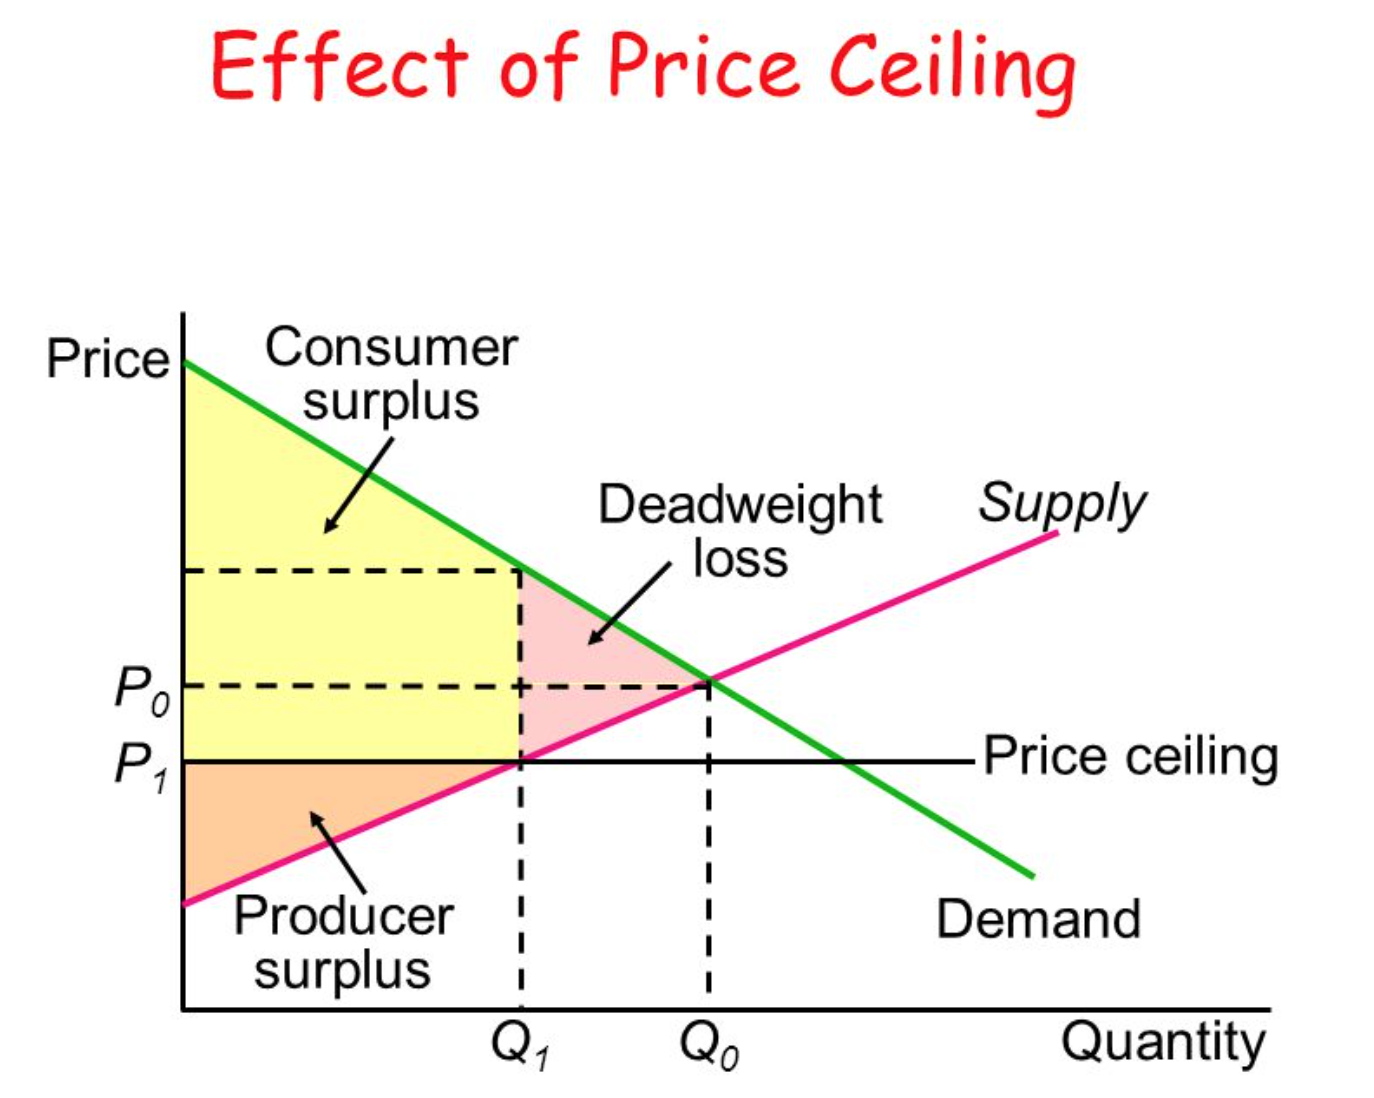
As seen in the graph, the price ceiling creates a deadweight loss (welfare loss), meaning that in totality, the social surplus has been reduced solely due to under allocation of resources.
- Consequences to stakeholders
- Consumers gain as they get goods for cheaper, however they also loose as not all get the good required
- Producers are worse off as they get to sell goods for a cheaper price and also a less quality
- Workers are laid off as less quantity requires less people to produce goods
Examples of Rent Controls and Food Price Controls
- Governments are not much changed, however they are better off in political popularity among the consumers who are better of
Rent Controls:
Price ceilings are placed also on rents of apartments as well.
This has many consequences: housing become more affordable to low income people. However, this creates a shortage of housing, which leads to long waiting lists, and also creates an illegal market. Lastly, there is run-down and lowly maintained buildings as its not a profitable business.
HL: Calculating effects
Shortage is equal to Q0 - Q1
Change in consumer expenditure changes from (P0 x Q0) to (P1 x Q1)
Change in producer revenue is same as consumer expenditure
Price Flooring
Price flooring is the government setting a minimum price for a good/service. This leads to a market disequilibrium resulting in excess supply.

Credit: http://img.sparknotes.com/figures/0/039bab1e6f1ef2a65b5f4c8ddc66073a/floor.gif
- Price floors are used to provide support for farmers incomes, and to protect low-skilled workers by offering wage above market level
Consequences of Price Flooring
- By setting a price on agriculture products above equilibrium, the aim is to provide farmers with a sustainable income instead of a unreliable one. However, this means that there is an increase in Qs while there is a decrease in demand, which then the government buys (excess supply). Therefore, the governments attempts to solve the disequilibrium by purchasing the excess
- Therefore, a surplus of quantity qs- qd is produced
- Any chosen method to dispose of the excess i problematic for the government: Firstly they may want to store it in, in which case there are immense storage costs
- Governments may also want to export the products, in which case they need to grant more subsidies to be able to lower the price to make it competitive
- Governments may choose to use the excess as aid to countries in need, which can be a problem for farmers in the recipient country
- It also encourages firm efficiency, as inefficient countries are safe from countries making cheap products efficiently, as the price sold is the same
- Overallocation resources (compared to free market equilibrium)

As seen on the graph, the Price flooring (Ppc) has created a deadweight loss (welfare loss). Also, you can see that producer surplus is now much bigger than the consumer surplus (totally opposite price ceiling)
To calculate the surplus and weight loss, just use basic mathematics and calculate using areas for triangles and rectangles.
If the government chooses to purchase the goods, that would shift the demand curve towards the right. In which case there will be a larger welfare loss with government purchase as the overallocation of resources has to be compromised by government expenditure which means opportunity cost.
Consequences of Price Flooring to stakeholders
- Consumers worse off as product is more expensive for lesser quantity
- Producers gain as they receive higher price and produce larger quantity and are protected from cheaper competitors
- Workers gain employment due to more production
- Governments are worse off as they need to purchase and handle the excess supply, being a burden on their budget
- Stakeholders in other counties are worse off as it leads to further misallocation worldwide, as high price agriculture products are bough at high prices and sold to other countries at lower prices, driving off local competition in recipient country.
HL: Calculating Effects of Price Flooring
Calculating Surplus is as easy as Qg - Qf (using diagram Price Flooring with Government Purchase)
Change in consumer expenditure is Pe x Qe to Pf x Qf
Government expenditure is Pf x (Qg - Qf)
Producer Revenue is Pf x Qg (if gov buys excess)
Minimum Wages
Price flooring is not only implemented on agriculture products or any products. They are also used to set a minimum wage to protect workers by donning a safe and substantial payment for their work .
The graph, however, is the same as above.
Minimum wages lead to an excessive amount of supply, more than what is demanded. This means there will be a sense of unemployment as people willing and able to work can't fin enough jobs, solely because workers being more expensive means that producers use minimum workers as possible for work to save on costs.
Moreover, it generates an underground market for illegal workers who work for less than minimum wage,
Labour intensive industries would be hit hard and would have to lay off workers, which means lesser production, or even exploitation of workers, as their cost of production rises ( shifts supply curve left)
Similar to the previous graph, the consumer surplus, in this case the employer, has a smaller area of surplus, while workers have a larger surplus. All these factors create a deadweight loss.
Consequences of Minimum wages for stake holders.
Firms are worse off as higher labour costs means higher cost of production
Workers suffer a mixed impact. Those who get a job benefit as they get a higher price for their work, while those who are laid off and unemployed are worse off
Consumers (in this case employers) are worse off as increase in costs mean decrease in supply of products (higher price, lower quantity)
Price Floors in Real Word
Minimum wages are very controversial, as although the theory may suggest that minimum wages leads to large numbers of unemployments, in reality some argue that the number unemployed due to price flooring is very miniscule.
However, most agree that price flooring on products leads to excess supply
There is evidently a bundle to know about this. I assume you made various nice points in features also.
ReplyDeleteeconomics tutor singapore
I’m not that much of a internet reader to be honest but your sites really nice, keep it up! I'll go ahead and bookmark your website to come back down the road. All the best
ReplyDeleteeconomics tuition singapore
Hey there! I know this is kinda off topic but I was wondering which blog platform are you using for this website? I'm getting sick and tired of Wordpress because I've had problems with hackers and I'm looking at options for another platform. I would be fantastic if you could point me in the direction of a good platform.
ReplyDeleteeconomics tutor singapore
Hello! This post couldn't be written any better! Reading this post reminds me of my old room mate! He always kept talking about this. I will forward this write-up to him. Fairly certain he will have a good read. Many thanks for sharing!
ReplyDeleteFemale Tutor online
Cool blog! Is your theme custom made or did you download it from somewhere? A theme like yours with a few simple adjustements would really make my blog stand out. Please let me know where you got your design. Kudos
ReplyDeleteeconomics tuition
Hi would you mind letting me know which webhost you're utilizing? I've loaded your blog in 3 different internet browsers and I must say this blog loads a lot quicker then most. Can you suggest a good web hosting provider at a honest price? Thanks, I appreciate it!
ReplyDeleteeconomics tuition
I am really loving the theme/design of your website. Do you ever run into any internet browser compatibility issues? A handful of my blog readers have complained about my site not operating correctly in Explorer but looks great in Chrome. Do you have any suggestions to help fix this problem?
ReplyDeleteJC Economics online
Looking to ace your IB Economics exams? Our specialized IB economics tuition is designed to give you the competitive edge. With tailored lessons, expert guidance, and a focus on key concepts, you’ll be able to confidently tackle both HL and SL subjects. Whether it's microeconomics, macroeconomics, or preparing for your Internal Assessment, our IB tuition helps you achieve your academic goals while boosting your overall performance. Take the first step towards mastering IB Economics today!
ReplyDeleteUnlock your full potential with our expert IB Economics Singapore tutoring services. We specialize in providing personalized lessons that cater to the unique needs of every student. Our qualified tutors ensure you understand complex economic concepts and are well-prepared for your exams. With our comprehensive IB Tuition, you'll build a strong foundation, boost your confidence, and achieve your academic goals in IB Economics. Join us today to start excelling in your studies!
ReplyDeleteDiscover the best online tuition for 9th class to conquer your math, science & other subject fears. Our expert tutors offer top-rated tuition classes for class 9, ensuring you excel in your studies with confidence. Join us and transform your academic journey today!
ReplyDeleteContact us for demo class - +91 9654271931 (India), +971- 505593798 (UAE).
For more info, visit - https://ziyyara.com